Positive Tropical Marine Low-Cloud Cover Feedback Inferred from Cloud-Controlling Factors
Projected 21st-century changes in marine low-cloud cover (LCC) are known to exhibit a large spread across general circulation models (GCMs), with the sign of the change being either positive or negative. In a previous study, we developed a two-variable heuristic model to interpret LCC changes in 36 climate simulations from phases 3 and 5 of the Coupled Model Intercomparison Project (CMIP3 and CMIP5). These two variables are: the tropical inversion strength (measured by the estimated inversion strength, EIS) and sea surface temperature (SST). Simulated 21st-century LCC changes in GCMs were approximated by the sum of EIS- and SST-induced LCC changes, where EIS- or SST-induced LCC changes are computed by multiplying the current climate's sensitivity of LCC to interannual EIS or SST variations, by (b) changes in EIS or SST over the 21st-century. The main goal of this paper is to elucidate the processes underlying LCC sensitivities to EIS and SST variations, and develop a method to constrain them observationally.
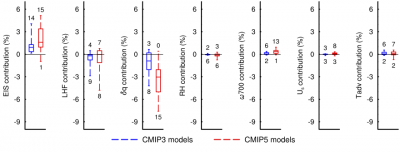
The process driving LCC sensitivity to EIS variations is well-understood. A stronger inversion suppresses mixing of boundary layer air with drier free-tropospheric air, leading to a shallower, moister and cloudier boundary layer. There is no strong consensus on the physical process underlying LCC sensitivity to SST variations, and SST may be a surrogate for multiple processes. A central goal of this study is to expand the two-variable heuristic model to include more variables, and shed light on the most important processes driving the SST sensitivity in GCMs. The additional variables included in a seven-variable heuristic model are: surface latent heat (LHF), the moisture contrast (dq) between the boundary layer and free troposphere, relative humidity in the free-troposphere (RH), vertical velocity at 700 hPa (W700), surface wind speed (Us), and horizontal temperature advection at the surface (Tadv). Terms associated with EIS, dq and LHF emerge as dominant (Fig.~1). The dq term contributes to an LCC decrease. The LHF term assumes large, negative values in many GCMs, but small, positive values are also seen. When combined, terms associated with LHF and dq successfully recover LCC changes associated with SST in the two-variable heuristic model. Terms associated with RH, W700, Us and Tadv are nearly negligible.
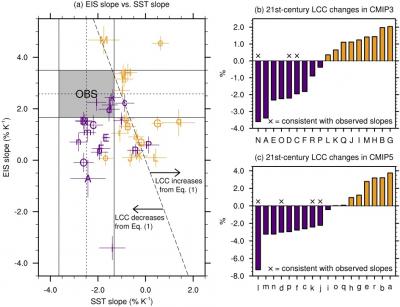
These results imply that the conventional interpretation of the simulated EIS sensitivity is correct, and that GCMs with EIS slopes outside observational bounds may have unrealistic EIS-LCC physics. These results also suggest a GCM’s SST sensitivity can be understood either as direct responses to temperature or as a combined response to changes in LHF and dq. Because LHF and dq sensitivities are not easily observed, we focus on GCM agreement with observed SST sensitivities. Satellite observed EIS and SST slopes and associated 5-95% confidence ranges are shown in Fig. 2. In about 75% of CMIP3 models and half of CMIP5 models, the EIS slope is less than observed. Similarly, the SST slope is smaller in magnitude than observed in about half the CMIP models. In only seven models are both EIS and SST slopes consistent with observed. These models give a range for LCC changes, -2 to -4% under the scenario A1B and -3 to -7% under RCP8.5. These predictions support a positive marine LCC feedback, albeit one with a large uncertainty range that includes both small and large 21st-century LCC decreases. Based on this study and others, we conclude that a negative marine LCC feedback is unlikely to be a credible response to anthropogenic forcing, and GCMs with a negative marine LCC feedback may systematically underestimate equilibrium climate sensitivity.
All authors are supported by DOE’s Regional and Global Climate Modeling Program under the project “Identifying Robust Cloud Feedbacks in Observations and Model.” The work of S.A. Klein was performed under the auspices of the United States Department of Energy by Lawrence Livermore National Laboratory under contract DE-AC52-07NA27344. We acknowledge the modeling groups, the Program for Climate Model Diagnosis and Intercomparison (PCMDI), and the WCRP’s Working Group on Coupled Modelling (WGCM) for their roles in making available the WCRP CMIP3 and CMIP5 multimodel data sets. Support of these data sets is provided by the Office of Science, U.S. Department of
Energy. We thank Peter Blossey, Chen Zhou, Mark Zelinka, and Yunyan Zhang for discussions on the topic and Fang Niu for her assistance on statistical methods.


