How Well are the Distribution and Extreme Values of Daily Precipitation over North America Represented in the Community Climate System Model? A Comparison to Reanalysis, Satellite, and Gridded Station Data
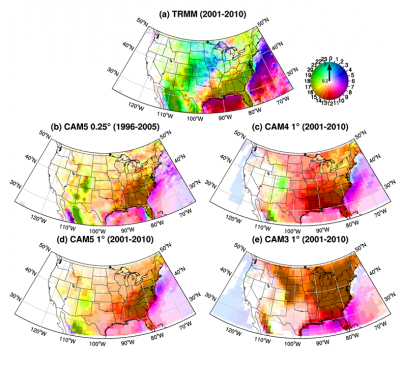
An intercomparison of the distribution and extreme values of daily precipitation between the National Center for Atmospheric Research Community Climate System Model, version 4 (CCSM4) and several observational/reanalysis data sources are conducted over the contiguous United States and southern Canada. The use of several data sources, from gridded station, satellite, and reanalysis products, provides a measure of errors in the reference datasets. An examination of specific locations shows that the global climate model (GCM) distributions closely match the observations along the East and West Coasts, with larger discrepancies in the Great Plains and Rockies. In general, the distribution of model precipitation is more positively skewed (more light and less heavy precipitation) in the Great Plains and the eastern United States compared to gridded station observations, a recurring error in GCMs. In the Rocky Mountains the GCMs generally overproduce precipitation relative to the observations and furthermore have a more negatively skewed distribution, with fewer lower daily precipitation values relative to higher values. Extreme precipitation tends to be underestimated in regions and time periods typically characterized by large amounts of convective precipitation. This is shown to be the result of errors in the parameterization of convective precipitation that have been seen in previous model versions. However, comparison against several data sources reveals that model errors in extreme precipitation are approaching the magnitude of the disparity between the reference products. This highlights the existence of large errors in some of the products employed as observations for validation purposes.

