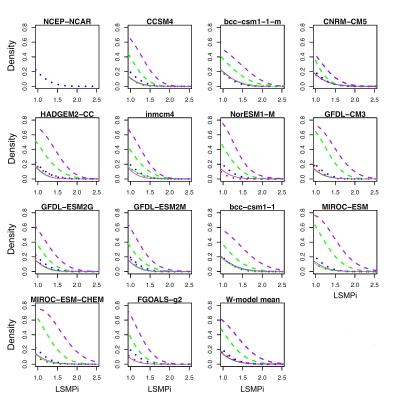
High Tail Properties For Different Climate Models
The California Central Valley heat wave synoptic pattern does not change in frequency or intensity from 1961–2000 to 2061–2100 in models. Heat waves are much more frequent and predominantly of one type when using historical thresholds due to the change in the climate “mean”. A multimodel average has 4 times as many heat waves, lasting 2 times as long, with 1.5 times the 20-year return value relative to historical value.
The paper develops a novel way to assess and weight climate model simulations of the future based on their historical performance. The multi-model averages weight each model on its relative performance in historical simulations of the specific extreme event type and location.
The hottest heat waves in California occur during specific large-scale meteorological weather patterns, or LSMPs. Global climate models can resolve such patterns. We average results from 13 climate models. We form an index (LSMPi) that measures how similar the model-generated pattern is (in structure and magnitude) to the LSMP found for historical extreme events in reanalyses. More weight is given those models that are better than other models at generating the LSMP and other properties of California heat waves during 1961–2000. A heat wave is when daily maximum temperatures over the Central Valley are in the warmest 5% of June–September days during the years 1971–2010. We examine RCP 4.5 and RCP 8.5. Multi-model averages are shown for 2061–2100. Depending on which RCP scenario, daily maximum temperatures will exceed those highest 5% values 6 to 8 times as often as now, about one fifth to one quarter of summer. The hottest days will be 3.5–6 °C (about 7–12 °F) hotter than the hotter days in recent memory. Those heat wave weather patterns are neither stronger nor occur more often in the future; instead, many more heat waves occur in future simulations from a general warming of western North America.

