Contrasting ITCZ changes over recent decades and under anthropogenic warming: causes and impacts
The Intertropical Convergence Zone (ITCZ) forms in the deep tropics as a planetary-scale band of rising air, intense rainfall and converging surface winds. It migrates north and south with the Sun, dominating the seasonal cycle of the deep-tropical circulation. The ITCZ plays an important role in regulating tropical waves and cyclogenesis, and is closely tied to the global circulation and energetic balance through the link of the Hadley cell.
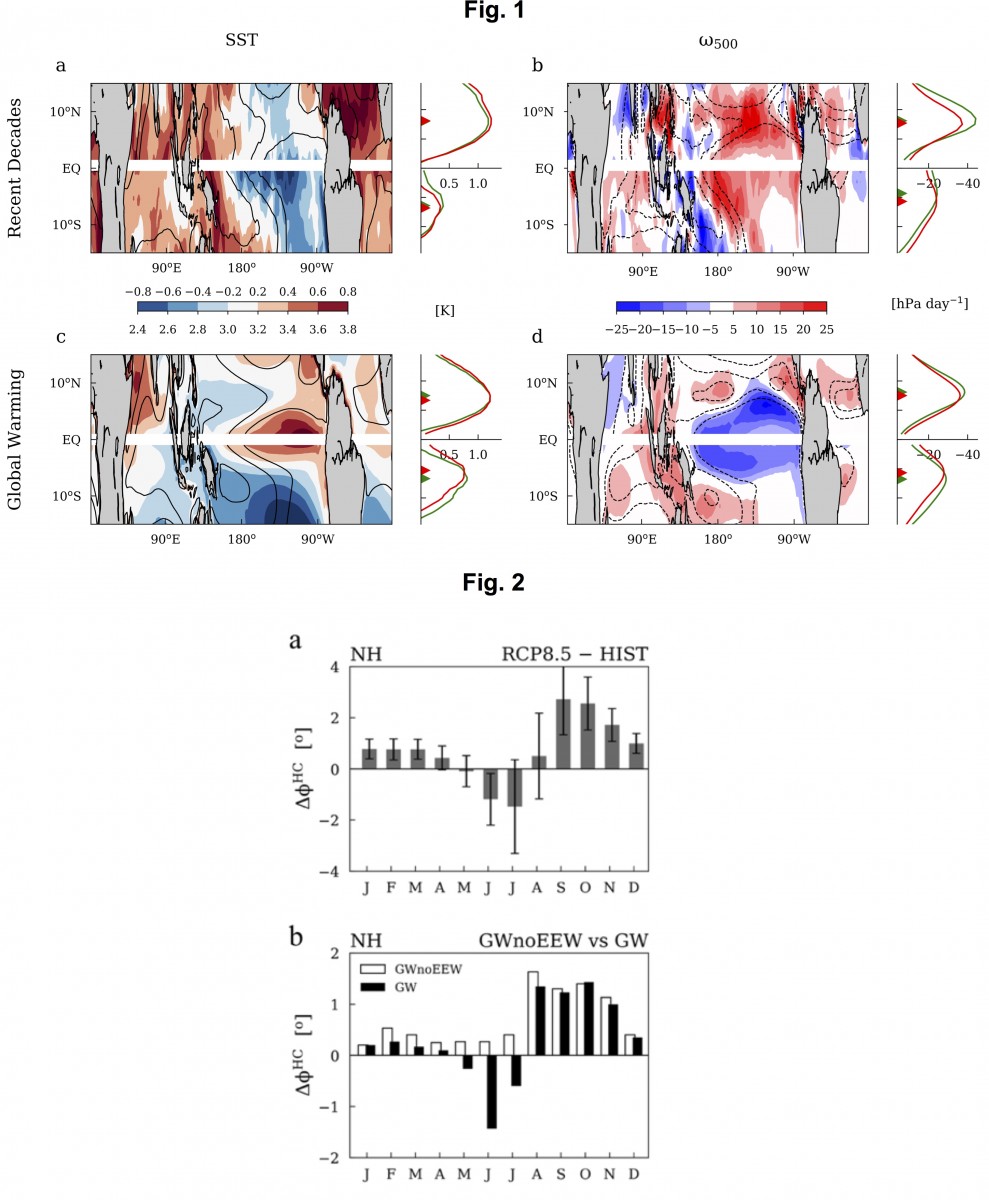
Here, we show the contrasting ITCZ changes over recent decades and under anthropogenic warming, and investigate their causes and impacts. The ITCZ has narrowed and shifted poleward over recent decades from 1979 to 2014. Under anthropogenic warming, the ITCZ is, however, projected to widen and shift equatorward. We show that such contrasting ITCZ changes are forced by distinct ocean warming patterns. Specifically, the equatorial East Pacific (EP) has cooled over recent decades due to the Pacific Decadal Oscillation (PDO) while enhanced warming is projected over EEP under anthropogenic warming because of the damped evaporation (climatological effect and circulation slowdown). The opposite equatorial warming relative to the tropical mean affects the seasonal SST peak and leads to the distinct changes in the ITCZ (Fig. 1).
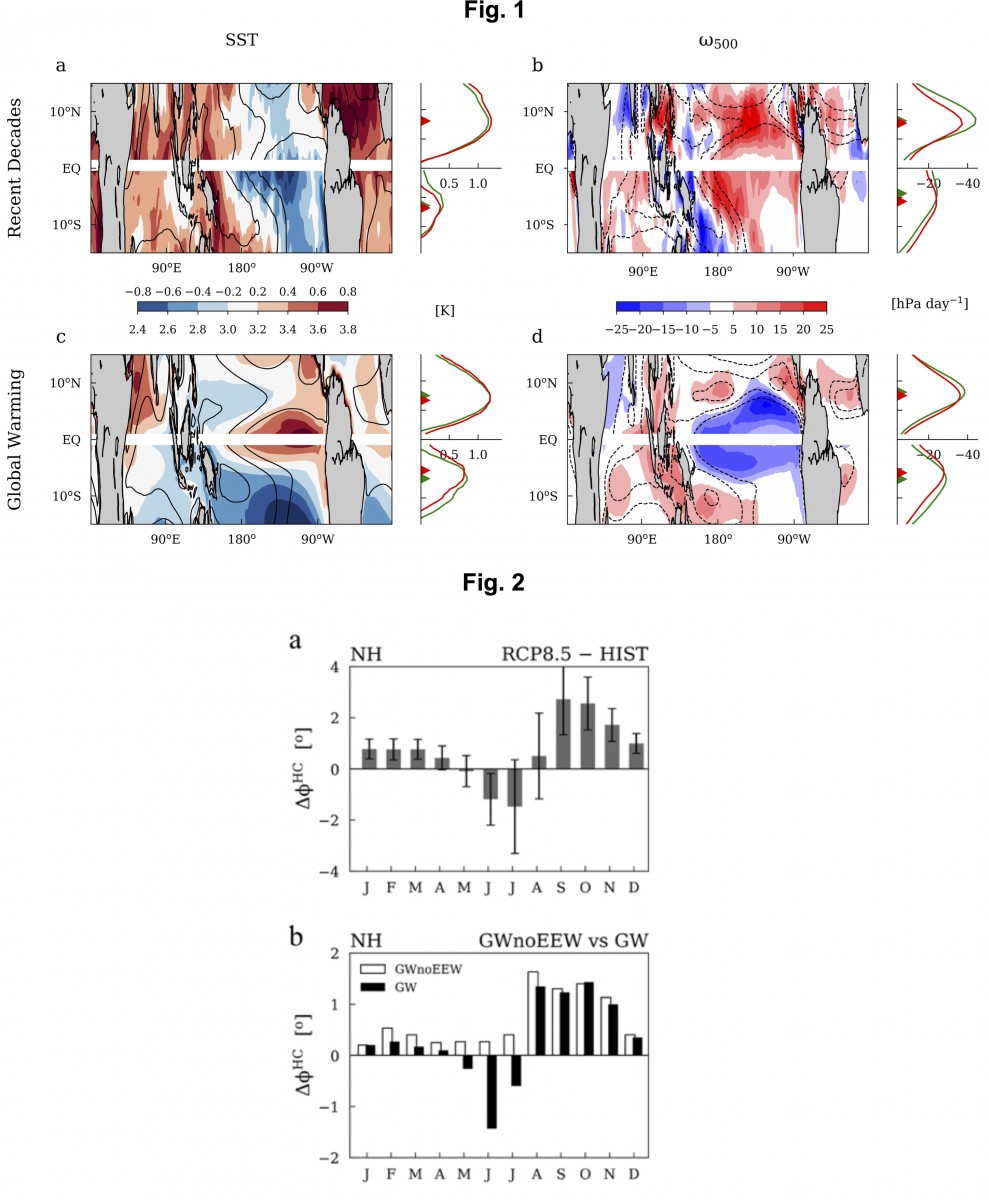
The ITCZ changes have pronounced climate impacts both within and beyond the deep tropics. The changes in the tropical cyclogenesis locations over recent decades and under anthropogenic warming are found to be closely regulated by the observed and projected ITCZ changes. The ITCZ shift can further influence the subtropical circulations. In particular, the project equatorward ITCZ shift contracts the subtropical circulation equatorward (Fig. 2), as seen during El Niño. This contraction counteracts the poleward expansion induced by the global-scale warming and even dominates in the northern hemisphere (NH) early summer (June-July) when atmospheric circulation responses to the global-scale warming are weak. This leads to significant regional climate changes in the subtropics, including the equatorward shift in the East Asian summer monsoon.
PDO is now changing into a positive phase. This time, it will work along with the anthropogenic warming, further amplify the enhanced warming over the EEP. In the coming decades, we expect to see amplified ITCZ changes that are opposite to recent trends. With its profound global impacts on circulations, hydroclimate and weathers, this calls for a reevaluation of preparedness and mitigation strategies.
Figure 1: Distinct ocean warming pattern and corresponding ITCZ changes over recent decades and under anthropogenic warming. (a) Trends (shading) and climatology (contours) of the warm-season SST (Jun-to-Nov for the NH and Dec-to-May for the SH) over recent decades from 1979 to 2014. The zonal-mean relative SST to the tropical mean (20°S-20°N) is plotted to the right (green for the 1979-1996 mean and red for the 1997-2014 mean), with the peak location denoted by the triangle symbols. (c) Changes of the warm-season SST under anthropogenic warming, estimated from the multi-model mean projection of the CMIP5 as the 2080-2099 mean in the RCP8.5 experiment minus the 1979-2005 mean in the HIST experiment. The HIST climatology is shown in contours. The zonal-mean is plotted to the right (green for the 1979-2005 mean in HIST and red for the 2080-2099 mean in RCP8.5). (b,d), Same as (a,c) but for the large-scale vertical velocity at 500 hPa, .

Figure 2: Seasonal-dependent contraction effect of enhanced EEP warming (EEW). a, Seasonal Hadley expansion projected by CMIP5 models in the NH. The Hadley expansion is measured by the shift in the poleward edge of the Hadley cell. The bars show the ensemble mean and the error bars indicate the multi-model standard deviation among CMIP5 models. b, Same as a, but for the seasonal Hadley expansion in the warming experiments using the GFDL-AM2.1 model. The unfilled bars show the responses to global surface warming without EEW (GWnoEEW) and the filled bars show the responses to full global surface warming (GW). The effect of EEW can be seen from the changes from the unfilled to filled bars.

